The usage of overlay css is to block the user interaction. It can be done by used 1 <div> element and Css styling.
Below is the source code to create overlay.
<!DOCTYPE html>
<html xmlns="http://www.w3.org/1999/xhtml">
<head>
<title>Overlay</title>
<style>
#ImOverlay{
position:absolute;
width: 100%;
height:100%;
background-color:rgba(0,0,0,0.8);
display:none;
}
</style>
</head>
<body>
<div id="ImOverlay"></div>
<p>How overlay works ?</p>
<button id="btnOverlay" type="button" onclick="ShowOverlay();">Show Overlay</button>
</body>
</html>
<script type="text/javascript">
function ShowOverlay() {
document.getElementById("ImOverlay").style.display = "block";
}
</script>
Programmer Lifestyle
A blog about programming languages. For example: matlab, java, c and etc.
Sunday, February 16, 2014
Tuesday, July 31, 2012
Factorial Computation Using Iteration ( Programming Language C )
This post will show the source code of factorial computation using iteration. In mathematics, the factorial of a non-negative integer n, denoted n!, is the product of all positive integers less than or equal to n. For example:
5! = 5 x 4 x 3 x 2 x 1 = 120 Iteration means the act of repeating a process usually with the aim of approaching a desired goal or target or result. In this case, for loop is represent the Iteration.
Source Code
Code::Blocks#include <stdio.h>
#include <conio.h>
void main()
{
int fact (int);
int number,factnum;
printf("\nEnter a positive number: ");
scanf("%d", &number);
factnum = fact(number);
printf("\nFactorial number for %d\! = %d", number,factnum);
getch();
}
int fact (int number)
{
int i,fact=1;
for (i=number;i>1;i--)
{
fact=fact*i;
}
return fact;
}
Wednesday, July 25, 2012
Facebook Social Plugins: Like Button
 |
| Facebook Like Button |
 | |
| A story appear in the Facebook when user clicks the Like Button. |
Step 1:
 | |
| Go to Layout |
Step 2:
 |
| Add Gadget |
Step 3:
 |
| Facebook page for the code generator of Like Button |
Step 4:
 |
| Code generated by Facebook |
Step 5:
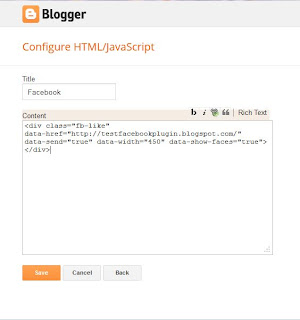
 |
| Paste first part of code to Content |
Step 6:
 |
| Add second part of code |
Step 7:
 |
| Like Button |
Histogram Equalization
Histogram Equalization is a popular technique for enhancing image contrast. Histogram Equalization can change in image brightness that is become much brighter than input image. Histogram Equalization has been a simple effective image enhancement technique but Histogram Equalization tends to change the brightness of an image significant, causing unnatural contrast enhancement. Besides that, Histogram Equalization is not commonly used on scanning electron microscope (SEM) image this method causes significant change on the input image brightness and introduce undesirable artifacts. The mean brightness Histogram Equalization image is always the middle gray level regardless of the input image mean, thus this characteristic is not desirable in application where brightness preservation is needed. As a result, Histogram Equalization is not commonly used in consumer electron because it could cause annoying distortions like excessive brightness change, noise artifacts and brightness saturation.
Source Code
Matlab version R2011b (7.13.0.564)
%original Image
originalImage=imread('cameraman.tif');
%define the size of image after Histogram Equalization
HEImage=uint8(zeros(size(originalImage,1),size(originalImage,2)));
%calculate total pixels of original image
numofpixels=size(originalImage,1)*size(originalImage,2);
%obtain intensity by using imhist
[intensity grayLevels]=imhist(originalImage);
%calculate the pdf of original image
pdf=intensity/numofpixels;
%calculate the cdf of original image
cdf=cumsum(pdf);
%convert to Histogram Equalization image by replace the pixels of original image
for i=1:size(originalImage,1)
for j=1:size(originalImage,2)
HEImage(i,j)=round(cdf(originalImage(i,j)+1)*255);
end
end
%showing and plotting the original image and image after Histogram Equalization
subplot (2,2,1);
imshow(originalImage);
title('Original Histogram');
subplot (2,2,2);
imhist(originalImage);
subplot (2,2,3);
imshow(HEImage);
title('Histogram equalization');
subplot (2,2,4);
imhist(HEImage);
Result:
 |
| Before and After Histogram Equalization |
Subscribe to:
Comments (Atom)